Documentation
Step-by-step guides for every tool on the YLB Security platform. Learn how to run your first scan, classify an AI system, track advisories and more.
Getting started
YLB Security is a single-platform experience — one account gives you access to all four tools. Here's how to get up and running.
Create an account
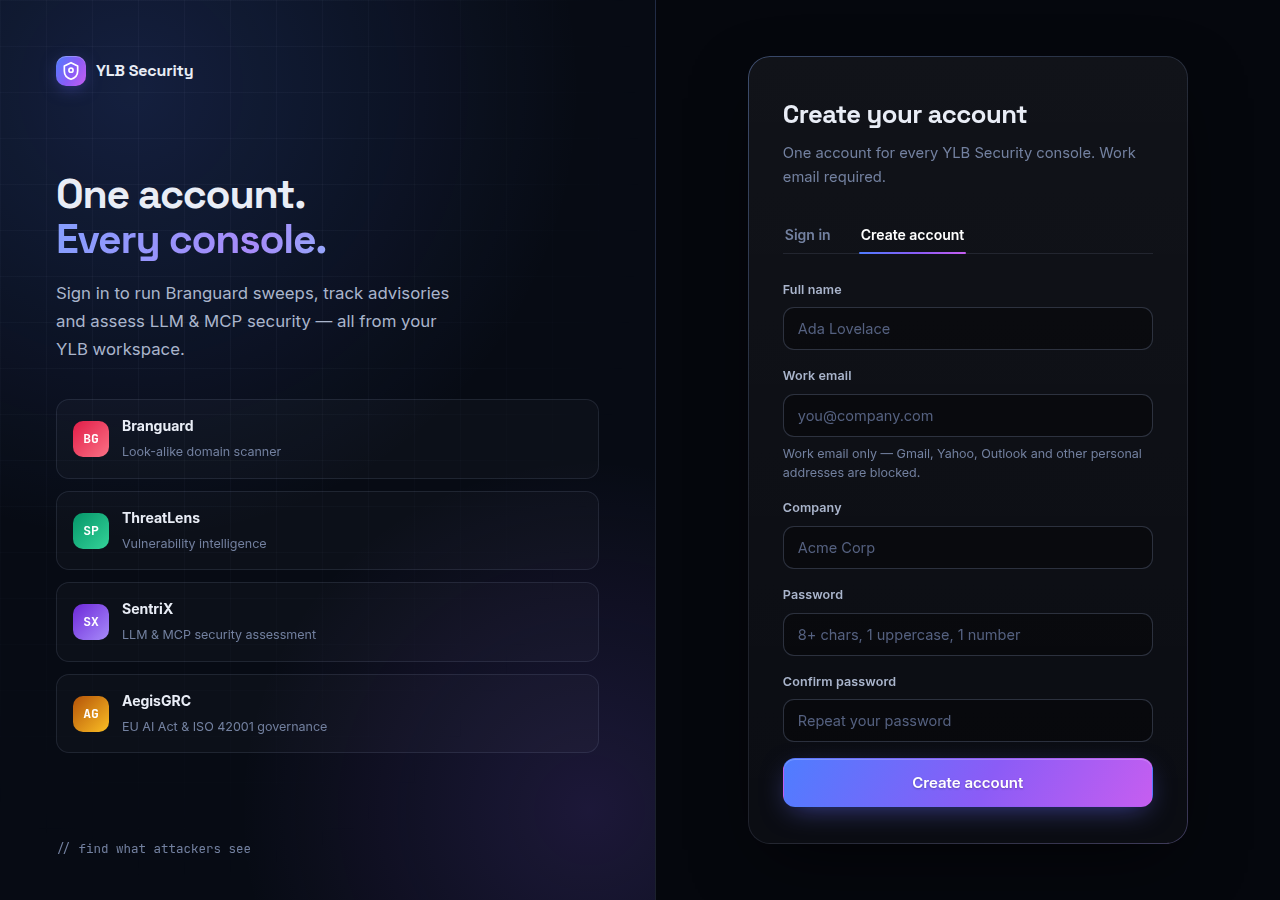
- Go to ylbsecurity.com and click "Get started" in the top-right corner, or navigate directly to the login page.
- Switch to the "Create account" tab. Enter your name, your work email (personal addresses like Gmail can't sign up), your company, and a password.
- Click "Create account". Check your inbox for the verification link, then sign in — you'll land in the Branguard console.
SentriX
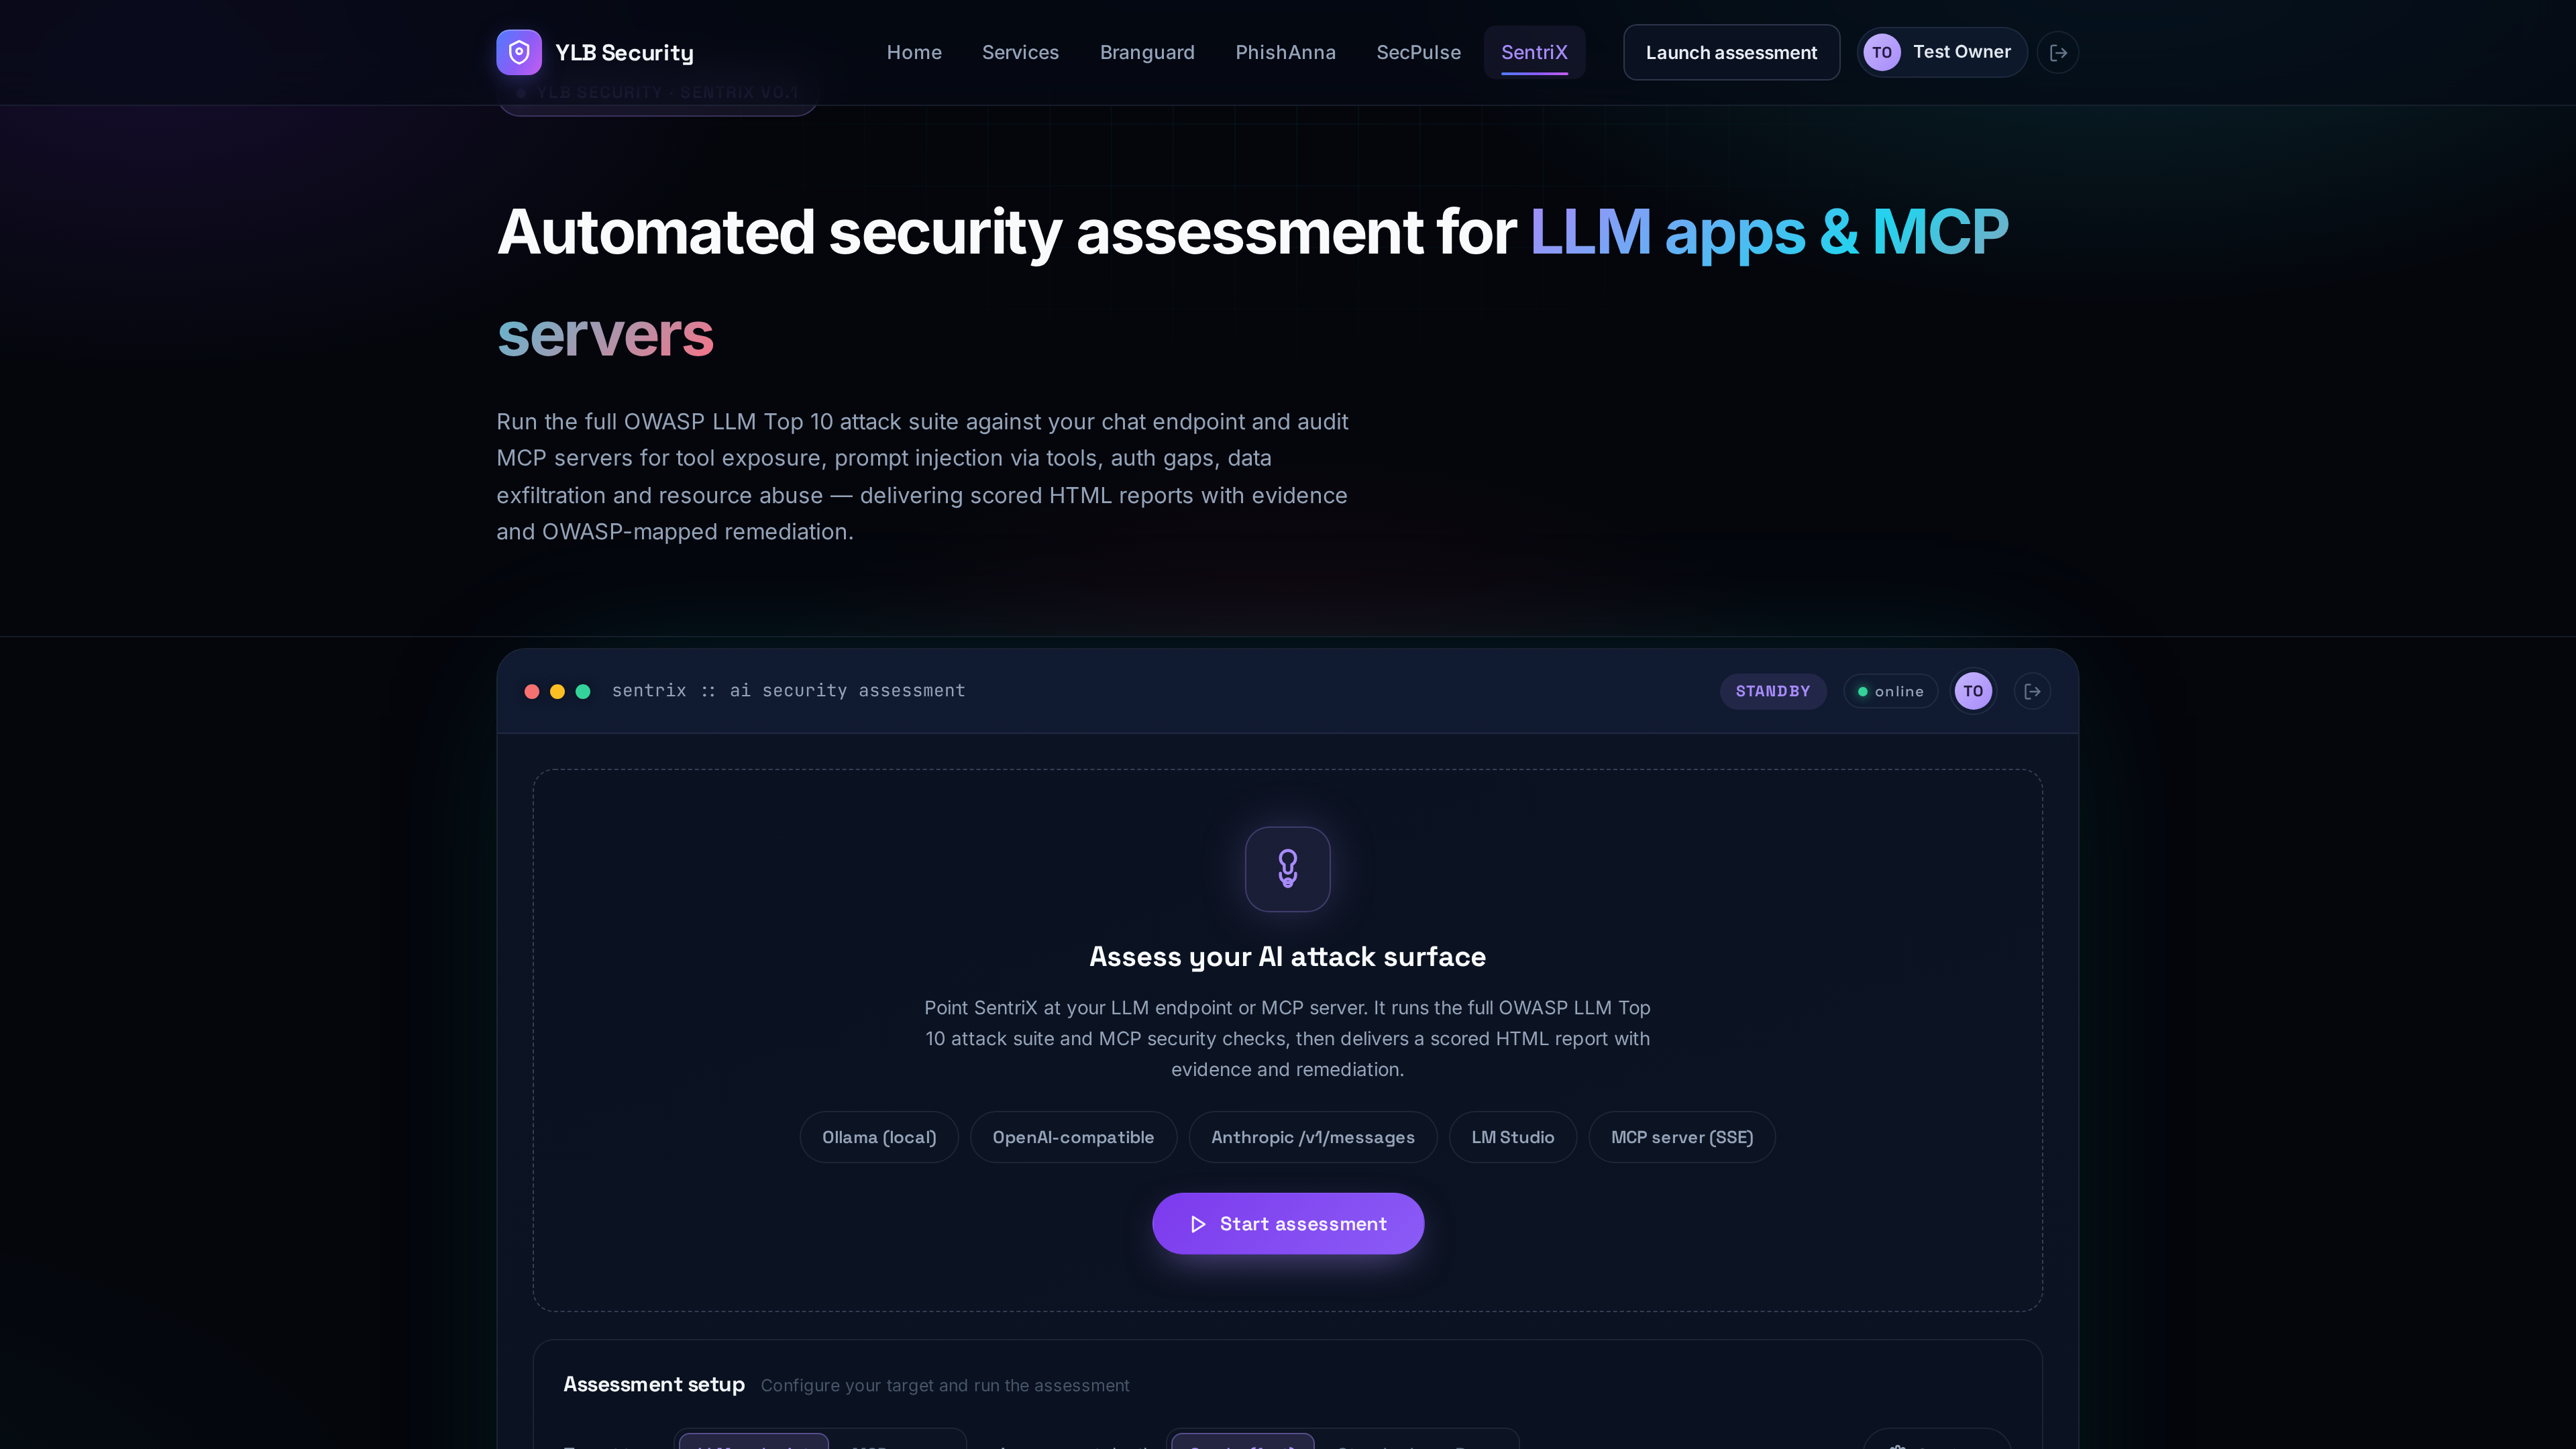
SentriX runs automated adversarial assessments against LLM applications and MCP servers. For chat endpoints it fires the full OWASP LLM Top 10 (2025) attack suite — 13 attack categories with deterministic pass/fail detection. For MCP servers it runs 15 checks covering authentication, tool exposure, injection, secrets and transport. Every finding ships with the exact evidence payload, a severity score, and OWASP-mapped remediation.
What kind of LLM app can you test?
Anything that answers chat requests in the OpenAI /chat/completions format — your support chatbot, RAG assistant, internal copilot, agent backend, or a raw model endpoint. If your app takes user text in and returns model text out, it qualifies. You test the deployed behavior, not source code: hardening, guardrails and system prompts are all exercised exactly as your users experience them.
https://api.openai.com/v1 (or your Azure deployment URL) with your API key. Costs a few cents per scan — use Smoke first.http://localhost:11434/v1. SentriX auto-discovers the right path./v1/messages protocol supported — paste the Messages endpoint and your x-api-key.Running an LLM assessment
- Open the SentriX console and select "LLM endpoint" as the target type.
- Choose scan depth: Smoke (~1 payload per attack, ~1 min), Standard (~2 per attack, a few minutes), or Deep (every payload variant, ~10–15 min). Set Max payloads to cap costs on metered APIs.
- Enter the endpoint URL. A bare host (
http://localhost:11434), a/v1base, or a full/chat/completionspath all work — SentriX probes candidates in order and remembers whichever answers. Azure-style URLs with query strings are used as-is. - Fill in Model (e.g.
gpt-4o,llama3.1), API key if the endpoint requires auth, and the system prompt your app uses in production (used to detect prompt leakage accurately). - Toggle Verify TLS off only for self-signed internal endpoints. Leave it on for everything public.
- Click "Start assessment". Progress moves through four phases: Reachability → LLM attacks → MCP scan → Report (the MCP phase is skipped for pure LLM targets).
- When complete, each finding shows the exact payload sent, the model's response excerpt that failed the check, and remediation. Click "Download report" for a self-contained HTML file.
The 13 attack categories
Each category maps to an OWASP LLM Top 10 (2025) family. A finding means the model demonstrably complied with the malicious instruction — not a theoretical risk.
What kind of MCP server can you test?
Any server speaking the Model Context Protocol — your data-workspace server, a tool gateway in front of internal APIs, a local dev server, or a third-party integration you are about to trust. SentriX inventories every exposed tool, resource and prompt, then probes what each one actually permits.
Running an MCP assessment
- Select "MCP server" as the target type and enter the endpoint URL (or stdio launch command).
- For protected servers, expand "MCP options" and add your Bearer token or OAuth credentials. Without a token, SentriX tests what an anonymous attacker sees — which is itself a valuable result (mcp01).
- Leave Active SSRF probe off unless you own the server and want proof: when on, SentriX asks a network-capable tool to fetch a canary URL, confirming real outbound requests.
- Click "Start assessment". SentriX lists tools, fires read-only probes, scans descriptions for injection bait and secrets, and checks transport security.
The 15 MCP checks
Understanding your score & results
Every assessment starts at 100. Each failed check subtracts points weighted by its OWASP severity (prompt injection and exploit generation weigh most; informational observations weigh least), producing a residual score and a letter grade:
- Filter with the severity chips: Critical, High, Medium, Low, Info. Info items are observations, not failures — read them, don't chase them.
- Open a finding to see what it is (plain-language explanation), the evidence (exact payload + response excerpt), affected tools (MCP), and remediation mapped to the OWASP guidance.
- Fix in this order: secrets & auth (mcp08, mcp01, LLM02) → injection paths (LLM01 direct/indirect, mcp07) → agency & exfiltration (LLM06, LLM07, mcp03) → everything else.
- Re-scan after each fix. History keeps every run, so a before/after pair (e.g. F → A) is your proof of remediation for auditors and customers.
Click "Download report" to export a self-contained HTML report — score, grade, severity breakdown, every finding with evidence and remediation, plus the MCP tool inventory — ready to attach to a security review or customer questionnaire.
5-minute quickstart: test a local model
No API keys, no cost, no excuses. Run a real assessment against a model on your own machine:
- Install Ollama from ollama.com and pull a small model:
ollama pull llama3.1:8b, then serve it (ollama serve— listens onhttp://localhost:11434). - In SentriX, select "LLM endpoint", depth Smoke, endpoint
http://localhost:11434, modelllama3.1:8b. No API key needed. - Click "Start assessment". In about a minute you will hold a graded report on a real model — compare its findings against the sample report to calibrate your reading.
Provider settings cheat-sheet
https://api.openai.com/v1 · Model gpt-4o-mini (cheap) · API key = your sk-… key · Start with Smoke + Max payloads 15?api-version=… (used as-is) · Model = deployment name · API key = Azure keyhttps://api.anthropic.com/v1/messages · API key = sk-ant-… sent as x-api-key · Model claude-sonnet-4-…http://localhost:11434 · Model llama3.1:8b · No key · Verify TLS irrelevant for httphttp://localhost:1234/v1 (enable CORS + API in settings) · Model = loaded model id · No key/v1 base · Model = served model id · Key only if your gateway requires oneTroubleshooting scans
AegisGRC
AegisGRC is your AI governance register. Inventory every AI system you operate, classify each one under the EU AI Act, run weighted risk assessments, track 22 compliance controls, and export an audit-ready report. The workflow mirrors what an auditor expects: register → classify → assess → control → report.
Overview dashboard
When you open AegisGRC, four summary cards tell you your posture at a glance:
Before you start: what counts as an AI system?
Register one entry per deployed use-case, not per model. One chatbot serving support and sales is two systems if the purposes, data and risks differ. Typical entries: customer support chatbot, resume screener, fraud detector, invoice parser, recommender, RAG assistant, vendor-built copilot. Include third-party and vendor systems too — the AI Act obliges deployers, not just builders.
Step 1 — Register an AI system
- Click "New system" to open the registration modal.
- Name (required, unique) — e.g. "HR Screening Assistant". Description & purpose — what it does and why it exists; auditors read this first.
- Data categories — None, Personal data, or Sensitive personal data. This drives Art. 10 data-governance expectations later.
- Lifecycle — Planned, Development, Production, or Retired. Anything else is rejected; keep retired systems for the audit trail instead of deleting them.
- Vendor / version — record who built it and which release you assessed, so re-assessments stay comparable.
- Click "Register system". It appears in your inventory — clicking it opens the wizard with Overview, Classification, Risk assessment and Delete tabs.
Step 2 — EU AI Act classification
Answer 11 yes/no triggers. Each maps to a specific article; your answers are stored as the documented rationale an auditor will ask for. The outcome is one of four tiers:
- Open the system → Classification tab and tick every trigger that applies. When in doubt, tick it — over-classification is cheap, under-classification is a regulatory finding.
- Add a note explaining borderline calls (e.g. "ranks candidates but a human makes the final hire — still Annex III employment").
- Click "Classify system". The tier, score and rationale are stored and shown as a chip in your inventory.
Step 3 — Risk assessment
Eight weighted questions (Art. 9/10) produce a 0–100 residual-risk score plus auto-generated mitigations mapped to specific AI Act articles. Higher points mean higher risk — answer honestly; the mitigations are the valuable output.
- Open the system → Risk assessment tab and answer all eight questions.
- Click "Run assessment". You get a score, a plain-language summary, and a mitigation per gap (e.g. "Introduce a human-in-the-loop review step — Art. 14").
- Assessments are versioned. Re-run after mitigations land, then use Compare to diff two versions question-by-question — a falling score over versions is your remediation proof.
Step 4 — Control tracking
22 controls in two frameworks. Filter by EU AI Act or ISO 42001:
- Set each control to Not started, In progress (half credit toward maturity) or Implemented.
- Attach evidence notes (up to 5000 characters) — policy names, SOP versions, dates. Evidence is what turns a status into an auditable claim.
- Upload evidence files (PDF, images, docs — 10 MB each, 10 per control): policies, training records, test reports. Download or delete them anytime.
Step 5 — Export audit report
- Click "Download audit report". A self-contained HTML file is generated: maturity bar, tier distribution, per-system classification rationale, latest assessment with mitigations, and the full 22-control matrix with evidence.
- Need spreadsheets? Export systems CSV and controls CSV for compliance handoffs.
- Everything is also in the audit trail (queryable, CSV-exportable): who registered, classified, assessed or changed what, and when.
How to read your results
Branguard
Branguard finds domains impersonating your brand — typosquats, homoglyphs, and visual clones — by generating hundreds of look-alike candidates, probing each one, capturing screenshots, and packaging takedown-ready evidence.
Run your first scan
- Open the Branguard console from the navigation bar.
- Enter your domain(s) in the tag input field. Type a domain and press Enter to add it. You can add up to 10 domains per scan.
- Alternatively, click "Upload file" to import a
.txtor.csvfile with one domain per line, or use "Paste list" to bulk-add domains. - Configure scan options:
Screenshots — enabled by default. Captures a live screenshot of every responding impostor domain.
Candidate count — choose 80, 150, or 250 look-alike candidates per domain. Higher counts take longer but catch more obscure typos.
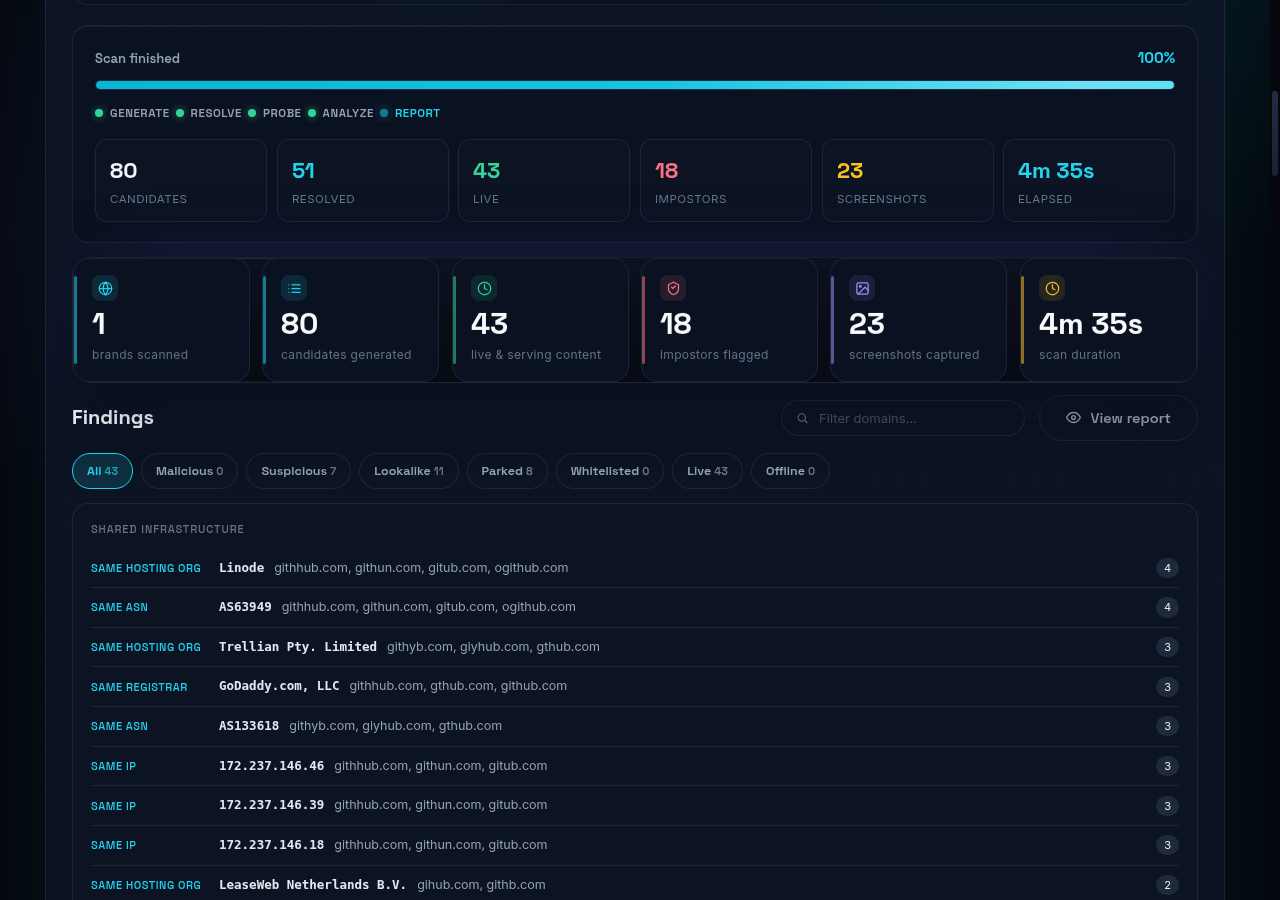
Email me the report — check it and the finished scan emails you its HTML + PDF reports. Unchecked scans never email. - Click "Start scan". The progress card shows five phases: Generate → Resolve → Probe → Analyze → Report.
- Watch live counters update: candidates generated, domains resolved, live sites found, impostors detected, screenshots captured.
Reading the results
- When the scan completes, results appear in a filterable findings table.
- Use the filter chips to narrow results: All, Malicious, Suspicious, Lookalike, Parked, Whitelisted, Live, Offline.
- Use the search box to find a specific domain.
- Click on any impostor row to expand it. You'll see:
— Screenshot of the impostor page (click to open in a lightbox for side-by-side comparison)
— Registrar / RDAP data: registrar, creation date, nameservers
— Hosting intel: IP address, ASN, geolocation
— Certificate info: issuer, validity dates - Click the download icon on any domain to export per-domain evidence as a ZIP file.
Understanding verdicts
Export reports
Whitelist
Prevent trusted domains from being flagged as impostors.
- Click the "Whitelist" button in Branguard.
- Add domains using exact match (e.g.,
partner.acme.com), subdomain match, or wildcard suffix (e.g.,*.acme.co). - Whitelisted domains are marked with a "Whitelisted" tag in scan results and excluded from threat counts.
Monitor (watchlist)
Set up continuous monitoring to catch new impostors as they appear. Scheduled rescans never send email — check the console or Reports center for new findings.
- Click the "Monitor" button in Branguard.
- Add a brand domain and choose a rescan interval: every 5 minutes, hourly, daily, or weekly.
- Branguard automatically re-scans at the set interval. New findings since the last scan get a "NEW" badge.
- If you've configured a Slack webhook (see Alerts) or checked "Email me the report" on the scan form, new impostor detections trigger a notification.
ThreatLens
ThreatLens is a daily vulnerability intelligence feed. It aggregates advisories from NVD, CISA KEV, GitHub Security Advisories, and Ubuntu USN — filtered to what actually matters for your stack.
Browse advisories
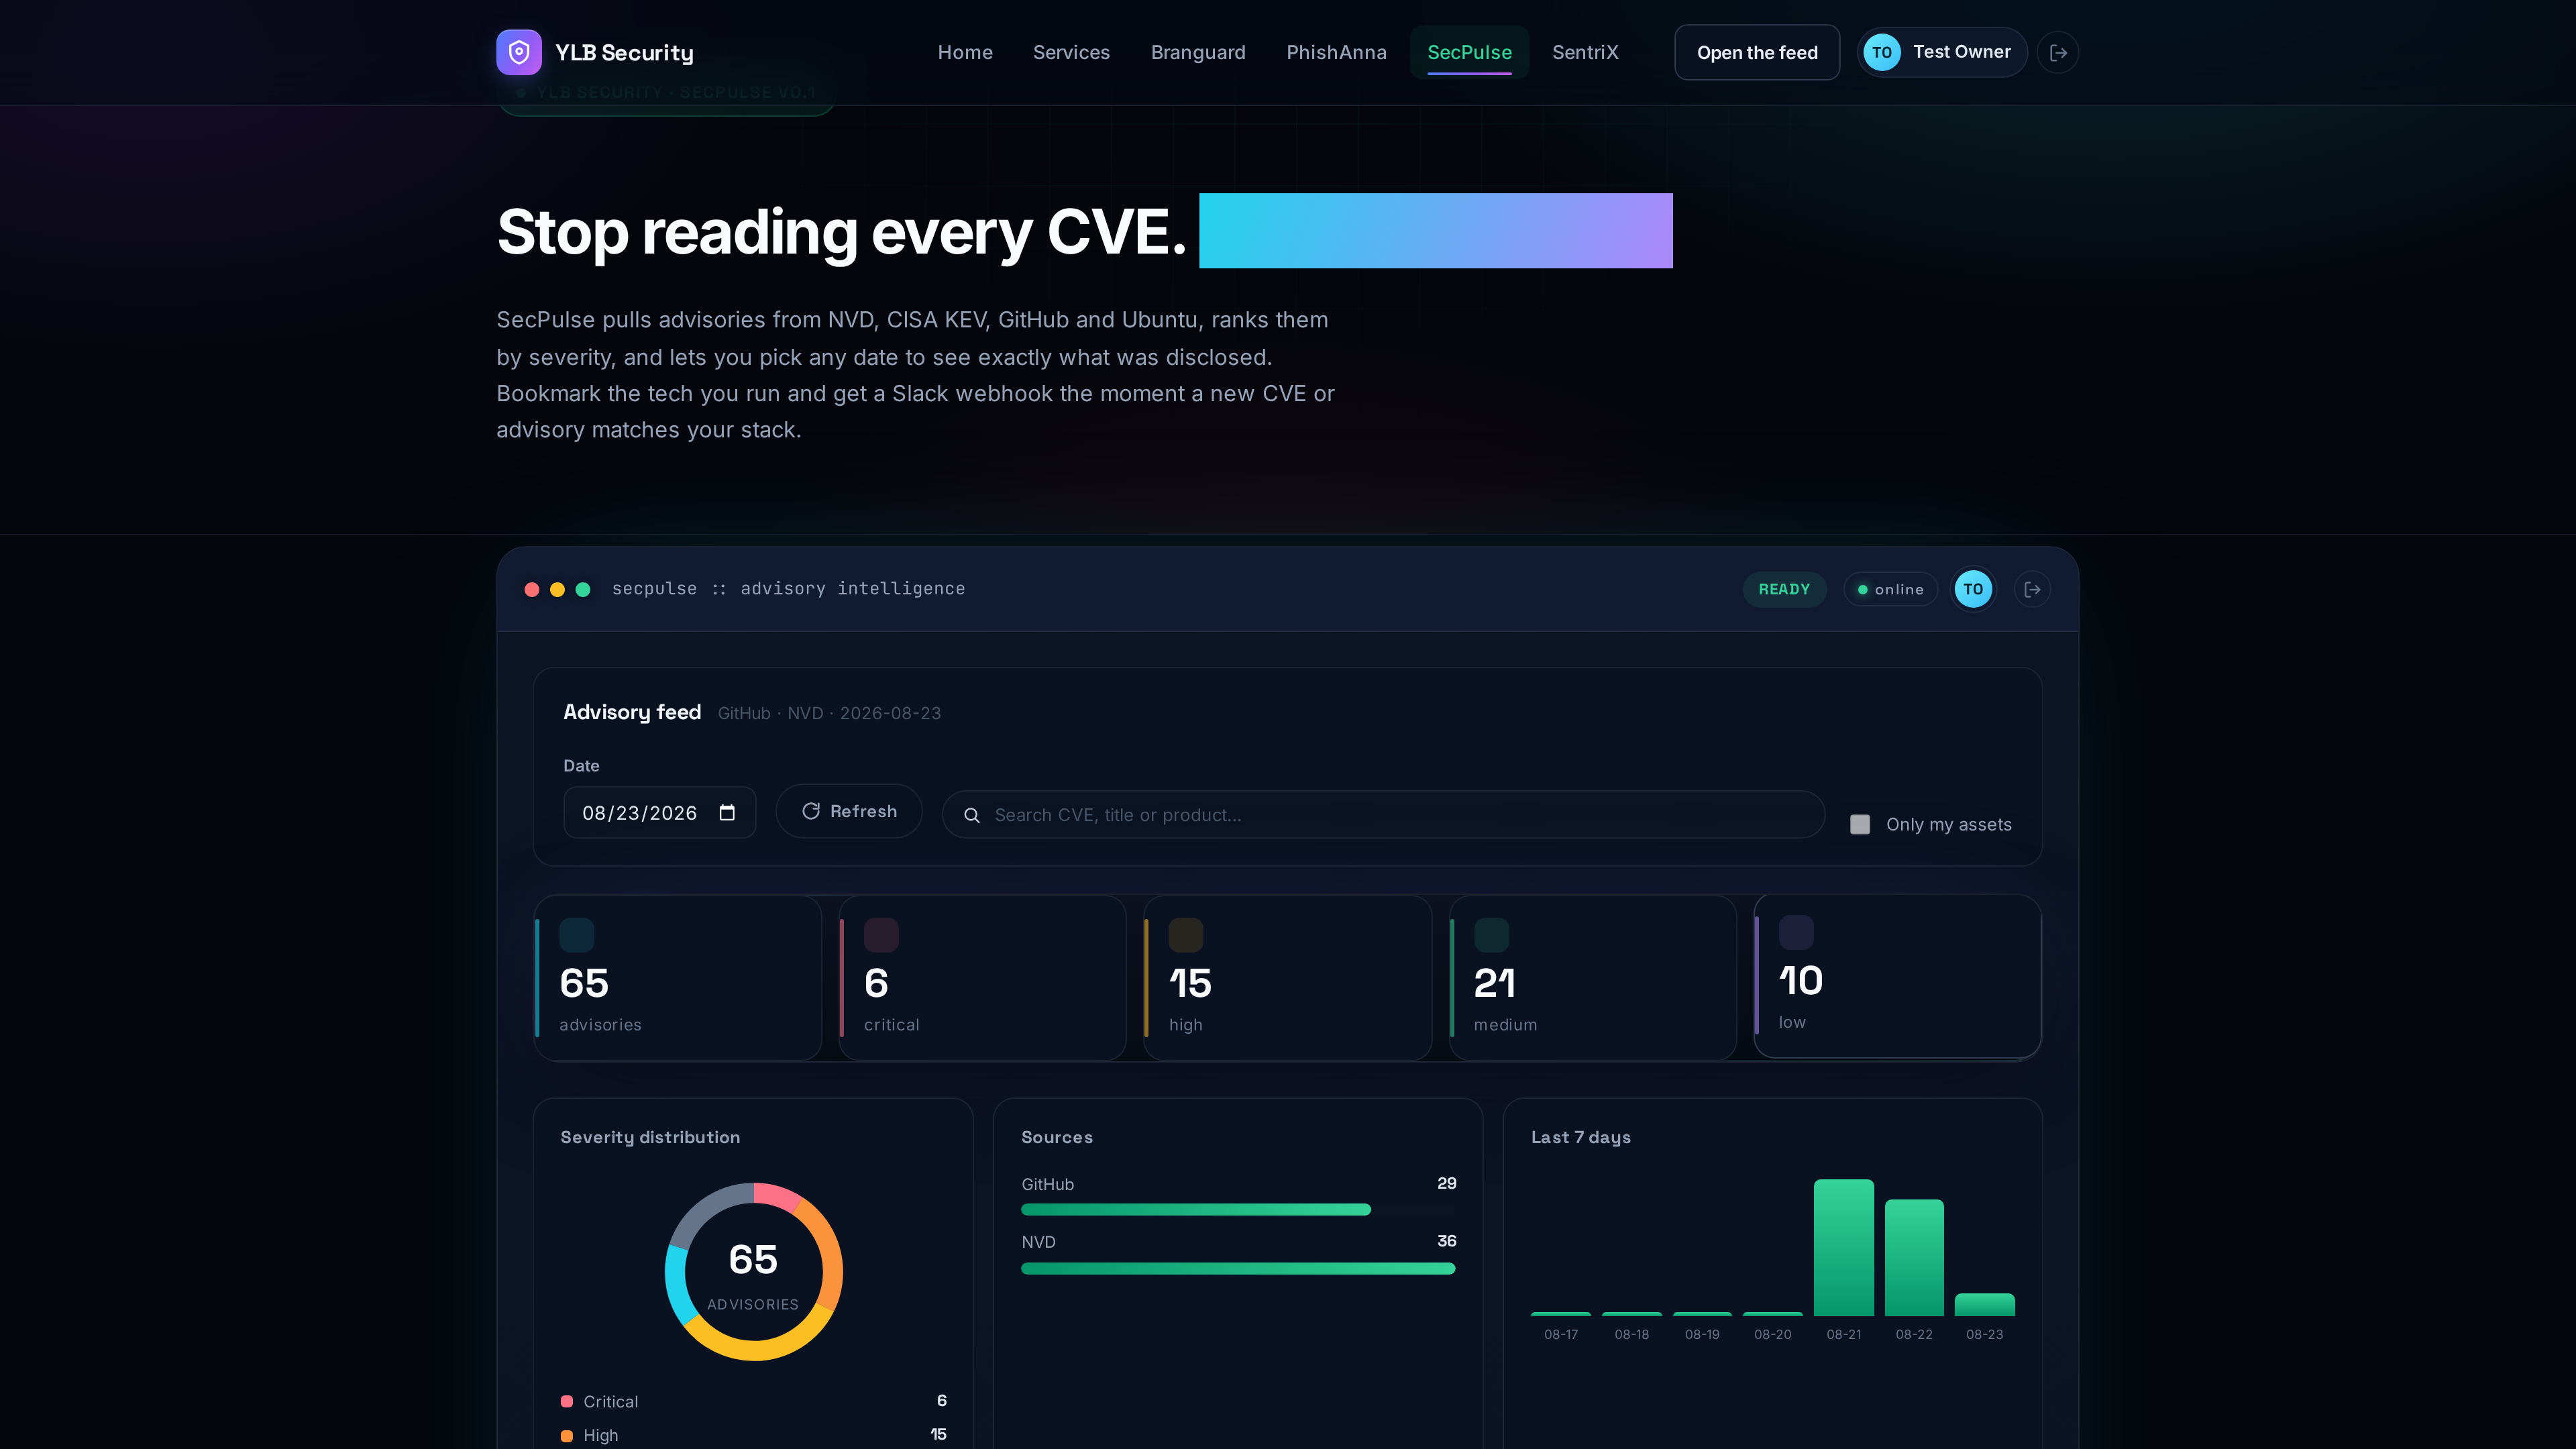
- Open the ThreatLens console. Today's advisories load automatically from all four sources.
- Use the date picker to navigate to any date. Click "Refresh" to force a re-fetch.
- Type in the search box to filter by CVE ID, product name, or keyword.
- Use the severity chips to show only Critical, High, Medium, Low, or Unrated advisories.
- The dashboard cards show totals for the day: advisory count, CISA KEV exploited count, and source/severity breakdown.
- Scroll down for charts: severity donut, source distribution, and a 7-day trend sparkline.
Security news
Below the advisory feed, ThreatLens aggregates headlines from Hacker News, The Hacker News, BleepingComputer, and Krebs on Security. The feed refreshes every 10 minutes.
Set up asset matching
Configure your tech stack so ThreatLens highlights advisories that affect you.
- Click the "Assets" tab to open asset management.
- Choose an import method:
Upload SBOM — drop a.txt,.csv,.xlsx, CycloneDX, or SPDX JSON file. ThreatLens parses it and extracts your component inventory. No file handy? Click Load sample data for an instant 18-package inventory.
Paste names — enter a list name and type package names one per line (e.g.,[email protected],postgresql).
Connect API — pick your provider and enter credentials. Supported: CrowdStrike Falcon (OAuth2 client ID/secret), Splunk (auth token + your own SPL search), Microsoft Defender XDR (Entra tenant/client ID/secret), Elastic Fleet (Kibana API key), Wazuh (manager username/password), SentinelOne (console API token), Tenable.io (access + secret key), or any generic HTTP endpoint. ThreatLens syncs immediately and auto-syncs daily. Note: Splunk and Wazuh commonly use self-signed certificates, so TLS verification is off for them unless you tick "Verify TLS certificate". - Once assets are configured, check "Only my assets" in the feed to filter advisories to those matching your stack.
Bookmarks & Slack notifications
- In the "Bookmarks" section, add technology names you want to track (e.g.,
nginx,react,openssl). - When a new advisory matches a bookmarked technology, it's highlighted in the feed.
- Configure a Slack webhook URL in the bookmarks panel. Critical advisories matching your bookmarks are pushed directly to your Slack channel.
- Use the "Send test" button to verify the webhook is working.
Alerts & notifications
Scan report emails are opt-in per scan: check "Email me the report" on the Branguard or SentriX setup form and the finished scan emails you its HTML + PDF reports. Unchecked scans never email you — scheduled watchlist rescans never email either.
Slack webhook
- Open Branguard and click the "Settings" tab.
- Under "Alert configuration", paste your Slack Incoming Webhook URL.
- Click "Send test alert" to verify the connection. A test message should appear in your Slack channel.
- Click "Save settings". New impostor detections and critical findings will now post to Slack automatically.
Reports & exports
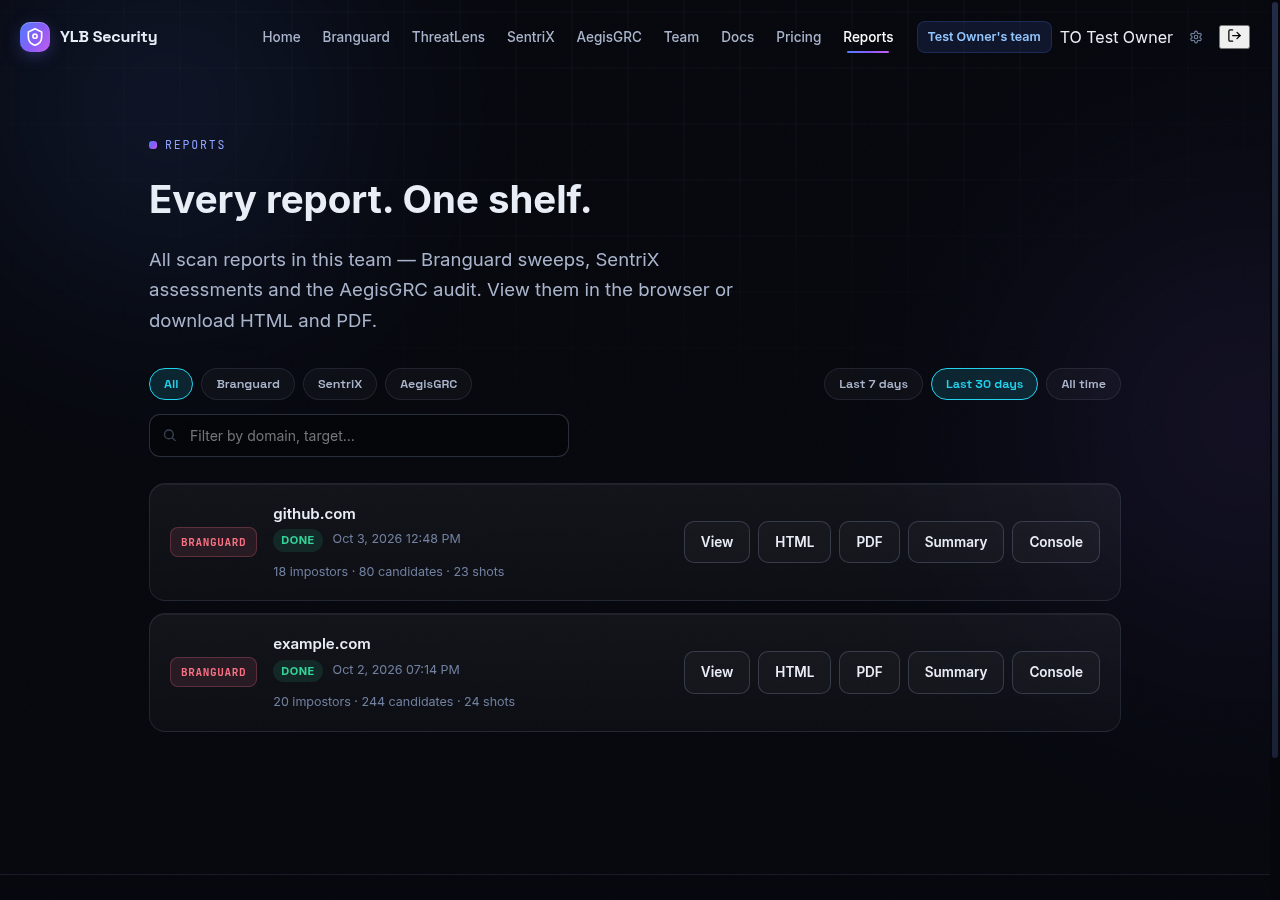
Every finished scan offers a single View report button in its console — the full report opens in a new tab with screenshots, evidence and remediation. The same reports live in the Reports center (top navigation) with HTML and PDF downloads per row.
Scan history
The Reports center is the cross-tool shelf for your whole team: Branguard sweeps, SentriX assessments and the AegisGRC audit, newest first, with tool filters, search and a Last 7 / 30 days / All time range (default: 30 days). Each console also keeps its own recent-scans history — click a row to reload that scan's findings without re-running it.
How long reports survive depends on plan: free and demo accounts keep 7 days of reports, paid workspaces keep 90 days. ThreatLens uses date-based navigation instead of scan history — select any date to view that day's advisories. AegisGRC data is persistent — your AI system register and control statuses are always available.
Teams & members
Everything in YLB Security belongs to a team: scans, systems, bookmarks, settings and reports are shared with teammates and invisible to outsiders. Open the Team page to see your current team, create more (up to 3 on Free), and invite people.
- Enter a teammate's work email and pick a role: Member (runs scans, edits data), Admin (manages the team), or Viewer (read-only — cannot start scans).
- If they already have an account they're added instantly; otherwise they get an invite code to sign up with.
- The team owner administers members and billing. Switch teams anytime from the Team page or the workspace chip in the navbar.
Plans, quotas & retention
Usage is counted per calendar month, per account. When a free limit is reached the scan is blocked with a clear message pointing at an upgrade — nothing fails silently.
API reference
Everything the consoles do is a REST call under /api — script scans, pull reports, and feed results into your own tooling. Two ways to authenticate:
- API keys (for scripts). Create one on the Account page, then send it as a Bearer token — no CSRF needed:
curl -H "Authorization: Bearer ylb_..." https://ylbsecurity.com/api/auth/me - Cookies (for browsers). Log in once, then include cookies on every call. POSTs also need the CSRF token: fetch
GET /api/auth/csrf, then send it asX-CSRF-Token(header or_csrffield).
Core calls
- Start a Branguard sweep:
POST /api/scan {"sites": ["acme.com"], "options": {"max_candidates": 150, "screenshots": true, "email_report": false}} - Poll it:
GET /api/scan/<id>— returns status, progress, findings and screenshot paths whenstatusisdone. - Take the reports:
GET /api/scan/<id>/report?view=1(inline HTML) ·GET /api/scan/<id>/report(HTML download) ·GET /api/scan/<id>/report/pdf(PDF) ·GET /api/scan/<id>/report/exec(exec summary). - Everything in your team, newest first:
GET /api/reports— Branguard + SentriX + AegisGRC with view/download links per row. - Assess an LLM or MCP server:
POST /api/sentrix/scan {"kind": "llm", "depth": "smoke", "endpoint": "https://...", "model": "..."}thenGET /api/sentrix/scan/<id>andGET /api/sentrix/scan/<id>/report/pdf. - Pull advisories:
GET /api/threatlens/feed?date=YYYY-MM-DD— severity-sorted NVD + CISA KEV + GitHub + Ubuntu items, annotated with your bookmark matches.
403 with an upgrade message when a cap is hit. Scan only infrastructure you own or are authorized to test.